


1800 - 1750 BCE
Dilling Housing 1800 BCE - 850 CE
i
©2025 Research by Yara Finne Hallenga at Umeå University
Buildings
- Residential/Barn Buildings
- Economical Buildings
- Pit Houses
- Possible Halls
- Other/Uncategorised Buildings
Transparency indicates lower confidence in date accuracy
Archaeobotanical data
- Cultivated Plants
- Arable Weeds and Ruderals
- Meadow and Pasture
- Wetland
- Berries and Nuts
- Other
IDW Interpolation Magnetic Susceptibility
- ≤ 15
- 15 - 20
- 20 - 25
- 25 - 30
- 30 - 35
- 35 - 40
- > 40
The magnetic susceptibility of a soil is its potential to be magnetized. This can be influenced by its iron content, but it is also increased by repeated heating of the soil. Unless acted on by outside forces, this effect lingers, meaning spots habitually used for fire centuries or even millennia ago could still be traced in the soil. The higher the MS value, the higher its magnetic potential.
IDW Interpolation Magnetic Susceptibility 550
- ≤ 50
- 50 - 70
- 70 - 90
- 90 - 110
- 110 - 130
- 130 - 150
- > 150
For this analysis, the MS is measured after a soil has been burned in an oven at 550 °C for several hours. A large change from the MS value before this firing indicates that the soil had not been heated before, while a relatively similar outcome suggests that it has.
IDW Interpolation Inorganic Phosphates (ppm)
- ≤ 150
- 150 - 200
- 200 - 250
- 250 - 300
- 300 - 350
- > 350
The phosphate content of a soil depends on the biological activity taking place on it. Human activities such as farming, animal husbandry, and the collection of waste can cause an increase. For this analysis, citric acid is used to detach phosphates from its bonds to inorganic material so that it can be measured in parts per million.
IDW Interpolation Total Phosphates (ppm)
- ≤ 250
- 250 - 300
- 300 - 350
- 350 - 400
- 400 - 450
- > 450
After burning the soil at 550 °C for several hours, all organic content has been burned away, leaving behind its phosphates. Adding citric acid to this burnt soil causes the phosphates bonded to both the inorganic and organic material to be released. Therefore, this analysis provides the total amount of phosphate content in the soil in parts per million.
IDW Interpolation Loss on Ignition (%)
- ≤ 1.00
- 1.00 - 1.75
- 1.75 - 2.50
- 2.50 - 3.25
- 3.25 - 4.00
- > 4.00
Weighing the soil before and after burning it at 550 °C for several hours will show how much organic content has been burned away, and therefore how much was in the soil to begin with. This is expressed in the percentage of organic content from the total soil.
IDW Interpolation PQuota
- ≤ 1.25
- 1.25 - 1.75
- 1.75 - 2.25
- 2.75 - 2.75
- > 2.75
This is calculated as follows: CitPOI/CitP = PQuota. This value represents a comparison of the inorganic and organic phosphates. A value of 1 would indicate that there are no organic phosphates present. A value of 2 suggests as many organic as inorganic phosphates, and higher indicates more organic than inorganic phosphates.
IDW Interpolation MSQuota
- ≤ 1.5
- 1.5 - 2.5
- 2.5 - 3.5
- 3.5 - 4.5
- > 4.5
This is calculated as follows: MS550 / MS = MSQuota. The higher the MS Quota, the more change in MS value after firing, and the less likely it is that the soil has been heated before.
About this project
Welcome! This site hosts the visualisation of published and unpublished data gathered at the archaeological site near Dilling, Norway. This visualisation was created as part of the master thesis of Yara Hallenga as part of the master programme in Environmental Archaeology at Umeå University, Sweden.
The site was excavated in 2017-2018, and a total of 138 buildings were discovered, along with many other features. These were observed to fit into seven separate housing areas, shown on the map with dashed lines. The first signs of habitation here date to the Bronze Age (c. 1700 BCE), while the last building stood at the end of the Iron Age (c. 800 CE).
The radiocarbon dating results of 109 buildings were available for this project. In addition, a great number of samples taken in or near the buildings were subjected to archaeobotanical and geoarchaeological analyses, the results of which were also provided.
The aim of the project was to visualise these various approaches to the site in a way that shows the chronological development of the settlement there. This development is shown in steps of 50 years, which is close to the maximum amount of detail that can be extracted from radiocarbon dating. The buildings form the basis of this visualisation, and options have been provided to include the archaeobotanical results and the geoarchaeological visualisations at your leisure.
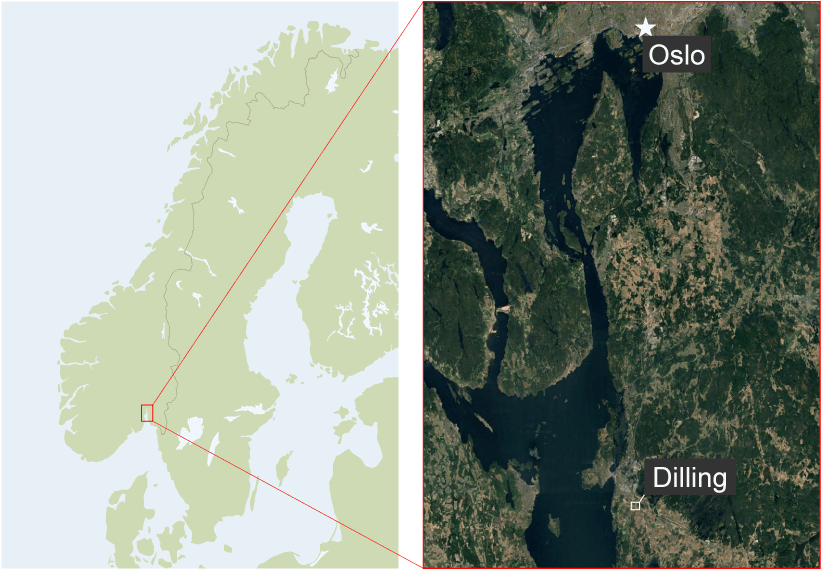
Site location
Buildings
The buildings found at Dilling are represented through their projected outlines, based on the excavated postholes and/or wall trenches. Each building appears in various degrees of opacity, which represents the probability of its existence at each 50-year step, as provided by the radiocarbon dating. The buildings are coloured according to their interpreted function. The outlines of the buildings that have not been dated can be added to the map as well.
Archaeobotanical data
Samples from the site were searched for plant macrofossils, mainly in the shape of seeds/fruits. These macrofossils have been identified to species, and then assigned to an ecological category. From a number of samples, one of the macrofossils was radiocarbon dated. Other samples were collected in regards to a certain dated building, and could also be shown in the timeline. So, for each 50-year step, a pie chart shows the number of macrofossils identified per ecological category per housing area. A label under each pie chart and the size of each pie chart both show the total number of macrofossils found in that housing area at that time.
Geoarchaeological layers
Each of these layers represents a different geoarchaeological aspect, visualised in an IDW interpolation. The concepts behind each set of values are explained below. These explanations are also included in each respective legend.
Magnetic Susceptibility (MS)
The magnetic susceptibility of a soil is its potential to be magnetized. This can be influenced by its iron content, but it is also increased by repeated heating of the soil. Unless acted on by outside forces, this effect lingers, meaning spots habitually used for fire centuries or even millennia ago could still be traced in the soil. The higher the MS value, the higher its magnetic potential.
Magnetic Susceptibility 550 (MS550)
For this analysis, the MS is measured after a soil has been burned in an oven at 550°C for several hours. A large change from the MS value before this firing indicates that the soil had not been heated before, while a relatively similar outcome suggests that it has.
MSQuota
This is calculated as follows: MS550 / MS = MSQuota. The higher the MS Quota, the more change in MS value after firing, and the less likely it is that the soil has been heated before.
Inorganic Phosphates (CitP)
The phosphate content of a soil depends on the biological activity taking place on it. Human activities such as farming, animal husbandry, and the collection of waste can cause an increase. For this analysis, citric acid is used to detach phosphates from its bonds to inorganic material so that it can be measured in parts per million.
Total Phosphates (CitPOI)
Burning the soil at 550 °C for several hours burns away all its organic content, leaving behind its phosphates. Adding citric acid to this burnt soil causes the phosphates bonded to both the inorganic and organic material to be released. Therefore, this analysis provides the total amount of phosphate content in the soil in parts per million.
PQuota
This is calculated as follows: CitPOI/CitP = PQuota. This value represents a comparison of the inorganic and organic phosphates. A value of 1 would indicate that there are no organic phosphates present. A value of 2 suggests as many organic as inorganic phosphates, and higher indicates more organic than inorganic phosphates.
Loss on Ignition (LOI)
Weighing the soil before and after burning it at 550 °C for several hours will show how much organic content has been burned away, and therefore how much was in the soil to begin with. This is expressed in the percentage of organic content from the total soil.
Further reading
For a more detailed explanation about the geoarchaeological analyses and an example of their application, see:
Goldberg, P. and Macphail, R.I. (2022). Practical and Theoretical Geoarchaeology. Second edition. Wiley Blackwell.
Grabowksi, R. and Linderholm, J. (2014). Functional Interpretation of Iron Age Longhouses at Gedved Vest, East Jutland, Denmark. Archaeological and Anthropological Sciences 6:329-343.
For a full explanation as to how this visualisation was created, see the upcoming publication of the master thesis of Yara Hallenga.